So far so good: last part left us with several services exposed by caddy with impressive domain names like ticketchangelog.domain.com, but that is not why are we here for. Therefore, edit your Caddyfile with an axe: remove all those selected lines
44    @podzir host podzir.domain.com
45
46    handle @podzir {
47        reverse_proxy podzir
48    }
49
50    @spin host spin.domain.com
51
52    handle @spin {
53        reverse_proxy spin
54    }
55
56    @remotegis host remotegis.domain.com
57
58    handle @remotegis {
59        reverse_proxy remotegis
60    }
What is left can be found here
What have we done? Essentially - removed few modules that have no rest endpoints anyway except two that every module has: healtcheck and metrics. What are we going to do with those details? - measuring performance and health is, at least declaratively, very important.
We’ll make use of prometheus - we have added it to the stack to do just that: scrapes services for healthcheck / metrics informations and queries them - bare neccessity for every kind of cool-to-look-at-graphs-and-facts presentation or dashboard.
Last time that we have checked prometheus was up and running at https://prometheus.domain.com so let’s see if it is still there. Start the whole circus (if it is not already started) using docker compose up -d and open https://prometheus.domain.com/targets
If everything still works as expected, there should be only one target declared: prometheus itself. When we look at prometheus configuration (prometheus.yml, volume reco-prometheus wherever it may be found in your case) it is perfectly clear that prometheus is configured to look just at itself:
19# A scrape configuration containing exactly one endpoint to scrape:
20# Here it's Prometheus itself.
21scrape_configs:
22  # The job name is added as a label `job=<job_name>` to any timeseries scraped from this config.
23  - job_name: "prometheus"
24    static_configs:
25      - targets: ["prometheus:9090"]
Let’s change that. Open prometheus.yml in editor and add those lines:
27    - job_name: "allegro"
28    static_configs:
29        - targets: ["allegro:80"]
30        labels:
31            reco: demo
32
33    - job_name: "remotegis"
34    static_configs:
35        - targets: ["remotegis:80"]
36        labels:
37            reco: demo
38
39    - job_name: "spin"
40    static_configs:
41        - targets: ["spin:80"]
42        labels:
43            reco: demo
44
45    - job_name: "podzir"
46    static_configs:
47        - targets: ["podzir:80"]
48        labels:
49            reco: demo
Pay attention to indentation as this is just the part you have to add to indenation-sensitive yaml file or take complete file from here.
Restart prometheus with docker compose restart prometheus, wait for some time and refresh prometheus targets page. If you have configured everything successfuly there should be five targets now: prometheus and additional four services that we have just configured.
Open prometheus graph page at https://prometheus.domain.com/graph and enter aspnetcore_healthcheck_status as expression. You should see dozen or so lines with different labels (“job”, “name”, “reco”, “instance”). Those labels are there for distinction between different services, naturally.
We can move further this way, adding separate prometheus scrape jobs for each service that we add but we can be more lazy, of course: there are many ways of service discovery, depending on the service stack. We will add another one, custom built. Why another one? Well, it turns out that none of the existing ones fits exactly the way we need.
Our custom prometheus discovery service is also docker container so it will be another service that we need to add to our compose.yml. We need some configuration for our service discovery service and that is the file named description.yaml and it should be placed somewhere where docker container can read it. We can create another docker volume as usual, or we can (as we are going to do) use some of the already existing volumes - in this case reco-prometheus volume sounds completely satisfactory as it is already used by prometheus itself. Create file named description.yaml in your reco-prometheus volume containing those lines:
services:
  allegro:
  podzir:
  spin:
  ticketchangelog:
  remotegis:
  authenticatomatic:
    scheme: "https"

service_groups:
  # default service group. if not specified, reco will have prometheus targets for specified services
  default:
    - ticketchangelog
    - remotegis
    - podzir
    - spin
    - allegro
    - sgw
    - dardo
    - xlab
    - vin
    - core112
    - allegro-sip
    - system

  authenticatomatic:
    - authenticatomatic

tekelija:
  demo:
    target: "{{.Service}}:80"

standalone:
  authenticatomatic:
    target: "authenticatomatic.domain.com"
    group: "authenticatomatic"
(or get the file from here)
Update your compose.yml file with another service declaration:
214  prometheus-discovery:
215    image: registry.gitlab.com/tekelija/tekelija-prometheus-discovery:latest
216    volumes:
217      - reco-prometheus:/cfg:ro
218    ports:
219      - 9184:9184
220    hostname: prometheus-discovery
Execute another docker compose up -d and there should be endpoint visible, listening on localhost, port 9184. Execute simple get request at localhost:9184 and you should see something like this:
{
    "http": [
        {
            "targets": [
                "ticketchangelog:80"
            ],
            "labels": {
                "job": "tekelija",
                "reco": "demo",
                "service": "ticketchangelog"
            }
        },
        {
            "targets": [
                "remotegis:80"
            ],
            "labels": {
                "job": "tekelija",
                "reco": "demo",
                "service": "remotegis"
            }
        },
        ...
    ],
    "https": [
        {
            "targets": [
                "authenticatomatic.domain.com"
            ],
            "labels": {
                "job": "authenticatomatic",
                "service": "authenticatomatic"
            }
        }
    ]
}
Basically, discovery is rest web service that prometheus will query for target definitions, and json data returned as response pretty much looks like prometheus configuration that we have created manually just few minutes ago. Ok, now we have to tell prometheus where to look for target definitions. Update your prometheus.yml:
21scrape_configs:
22  # The job name is added as a label `job=<job_name>` to any timeseries scraped from this config.
23  - job_name: "prometheus"
24
25    # metrics_path defaults to '/metrics'
26    # scheme defaults to 'http'.
27
28    scheme: https
29
30    tls_config:
31      insecure_skip_verify: true
32
33    static_configs:
34      - targets: ["prometheus.domain.com"]
35
36  - job_name: "http"
37    scheme: "http"
38    scrape_interval: 5s
39    http_sd_configs:
40      - url: "http://prometheus-discovery:9184/?scheme=http"
41
42  - job_name: "https"
43    scheme: "https"
44    scrape_interval: 5s
45    tls_config:
46      insecure_skip_verify: true
47
48    http_sd_configs:
49      - url: "http://prometheus-discovery:9184/?scheme=https"
(complete file is here)
Restart prometheus using docker compose restart prometheus, wait for a minute or more and refresh prometheus targets page. You should be able to see something like this:
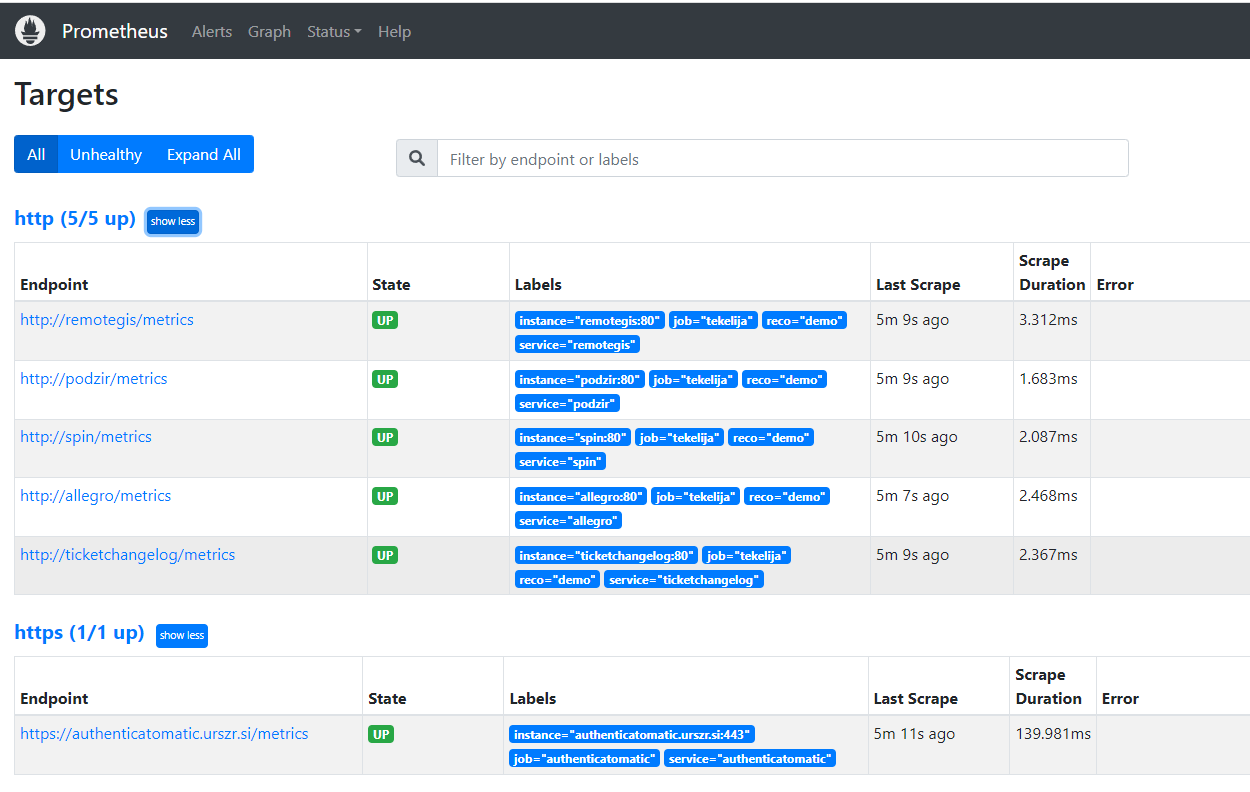
and query:
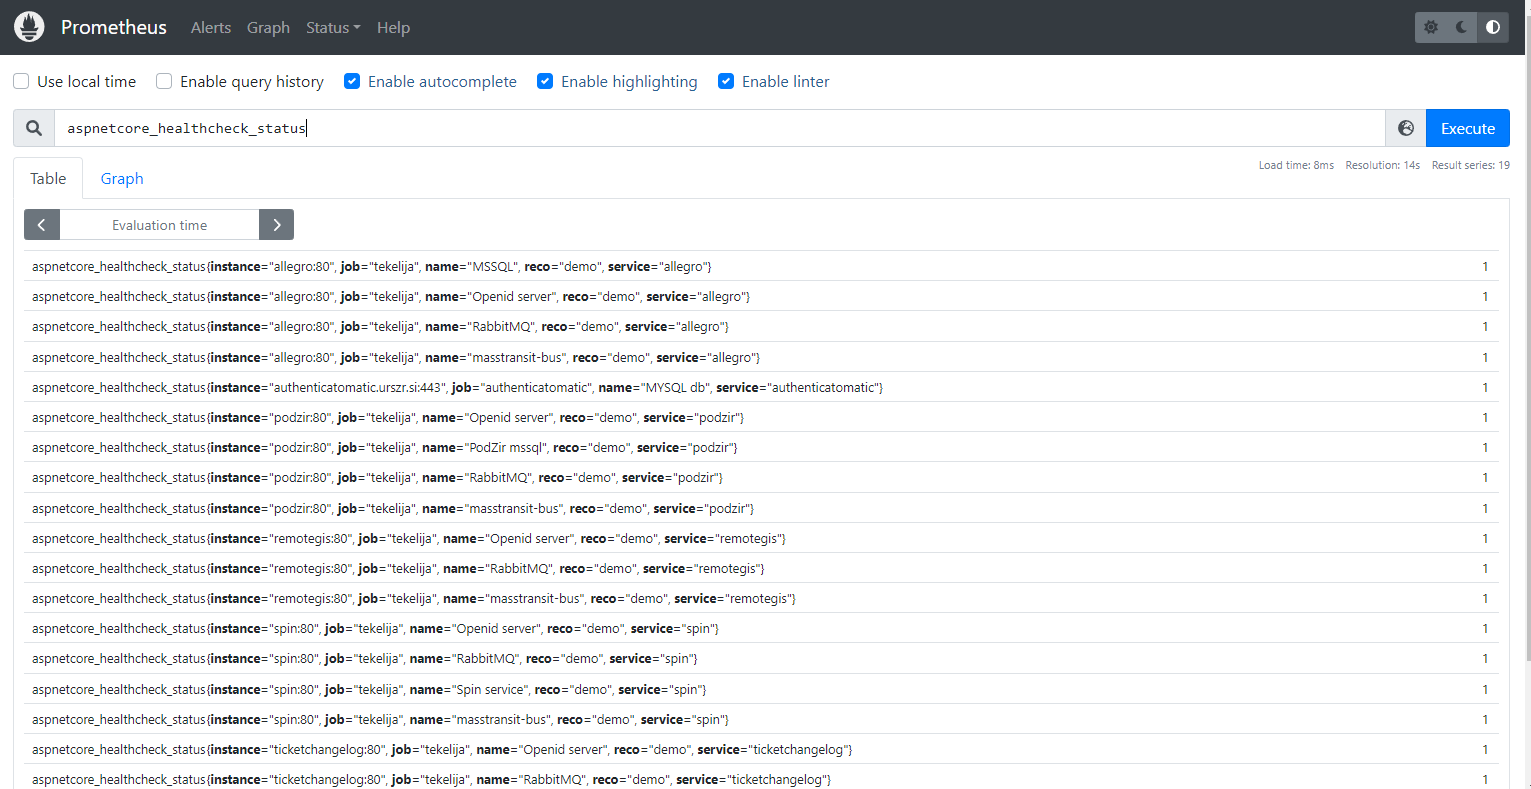
Cool, now we should have (almost) everything we need to display some graphs so stay tuned.